(JPY in Thousands)
| FY2021 | FY2022 | FY2023 | FY2024 | FY2025 | FY2026 Forecast | |
|---|---|---|---|---|---|---|
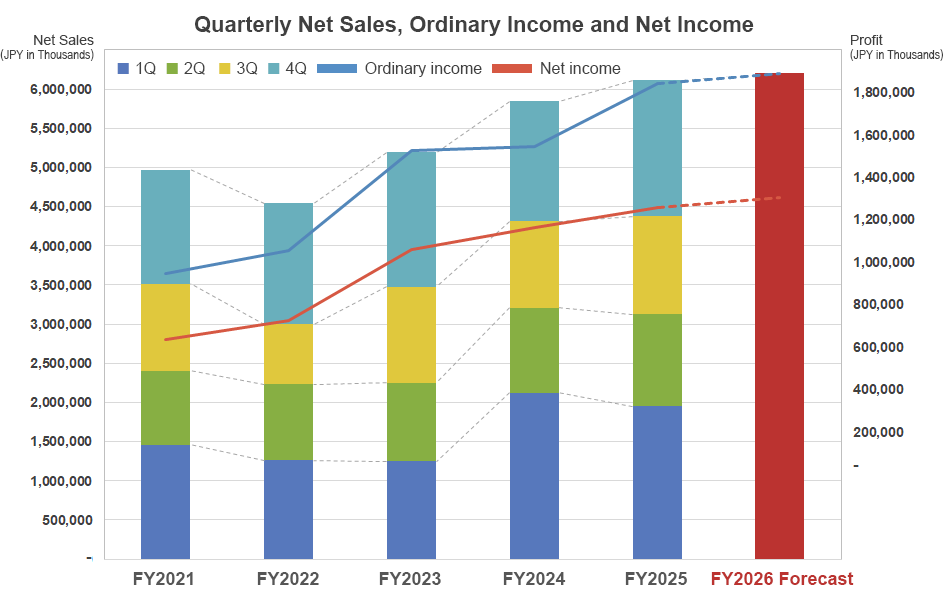
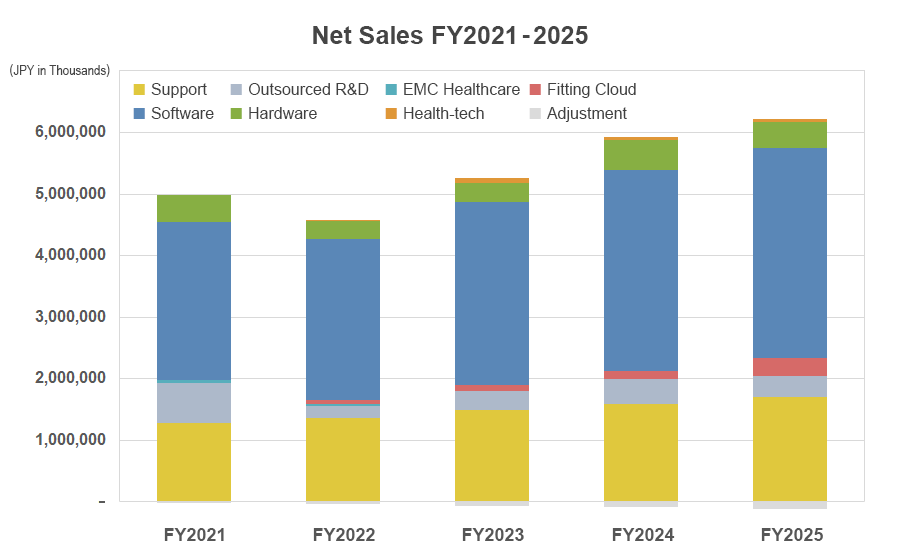
| Net sales | 4,968,885 | 4,541,242 | 5,191,735 | 5,841,379 | 6,109,941 | 6,209,000 |
| Q1 | 1,462,682 | 1,264,576 | 1,251,802 | 2,124,578 | 1,951,584 | - |
| Q2 | 942,696 | 969,065 | 997,439 | 1,080,942 | 1,174,019 | - |
| Q3 | 1,108,292 | 766,017 | 1,225,097 | 1,104,665 | 1,247,330 | - |
| Q4 | 1,455,215 | 1,541,583 | 1,717,396 | 1,531,192 | 1,737,006 | - |
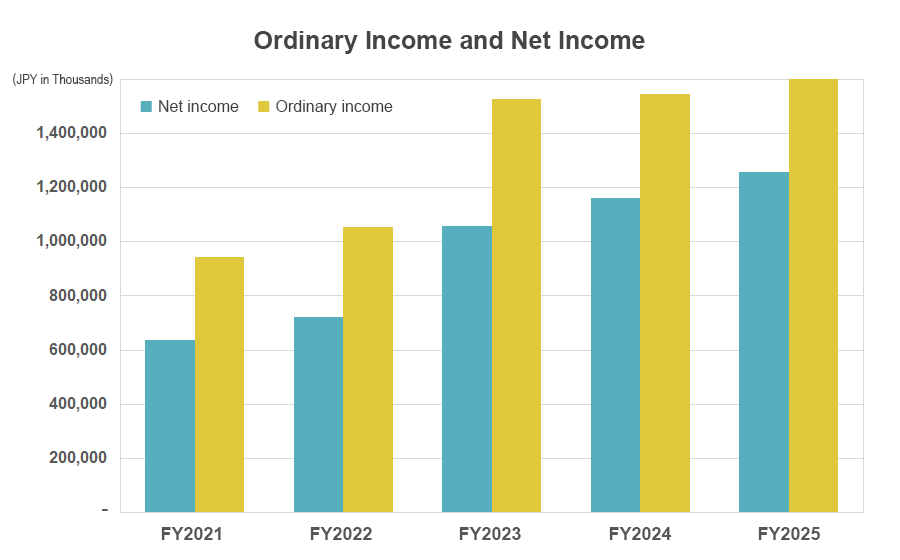
| Ordinary income | 944,593 | 1,055,708 | 1,527,453 | 1,544,705 | 1,840,735 | 1,889,000 |
| Net income | 636,027 | 722,779 | 1,059,140 | 1,162,365 | 1,256,970 | 1,302,000 |
*Click to zoom in
Quarterly Net Sales, Ordinary Income and Net Income| FY2021 | FY2022 | FY2023 | FY2024 | FY2025 | |
|---|---|---|---|---|---|
| Net sales (JPY in thousands) | 4,968,885 | 4,541,242 | 5,191,735 | 5,841,379 | 6,109,941 |
| Ordinary income (JPY in thousands) | 944,593 | 1,055,708 | 1,527,453 | 1,544,706 | 1,840,735 |
| Net income (JPY in thousands) | 636,027 | 722,779 | 1,059,140 | 1,160,549 | 1,256,970 |
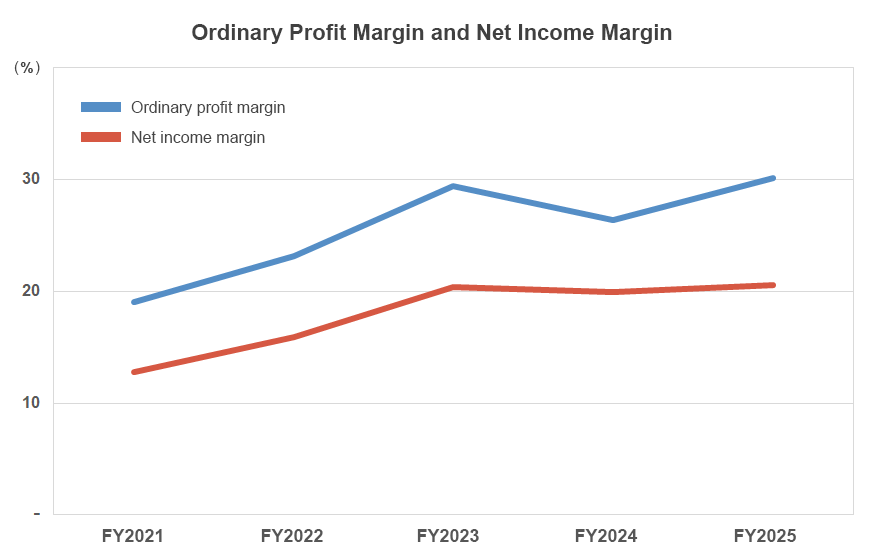
| Ordinary profit margin (%) | 19.0 | 23.2 | 29.4 | 26.4 | 30.1 |
| Net income margin (%) | 12.8 | 15.9 | 20.4 | 19.9 | 20.6 |
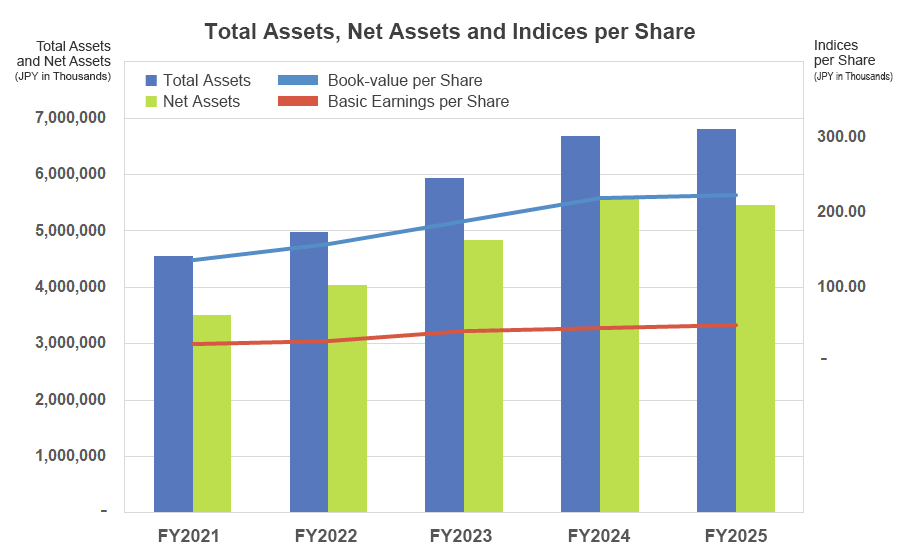
| Net assets (JPY in thousands) | 3,512,533 | 4,042,937 | 4,845,360 | 5,607,191 | 5,467,095 |
| Total assets (JPY in thousands) | 4,556,563 | 4,980,780 | 5,934,285 | 6,684,104 | 6,807,858 |
| Basic earnings per share (JPY) | 24.84 | 28.21 | 41.31 | 45.30 | 50.1 |
| Book-value per share (JPY) | 136.84 | 157.63 | 188.67 | 218.24 | 222.9 |